Skip to content
Planned for v0.3

Monitoring and alerts with nothing extra to install

Metrics, logs, events, health conditions and alert rules are part of the control plane. Each alert comes with a runbook, and the dashboards also work in the Grafana you may already run.
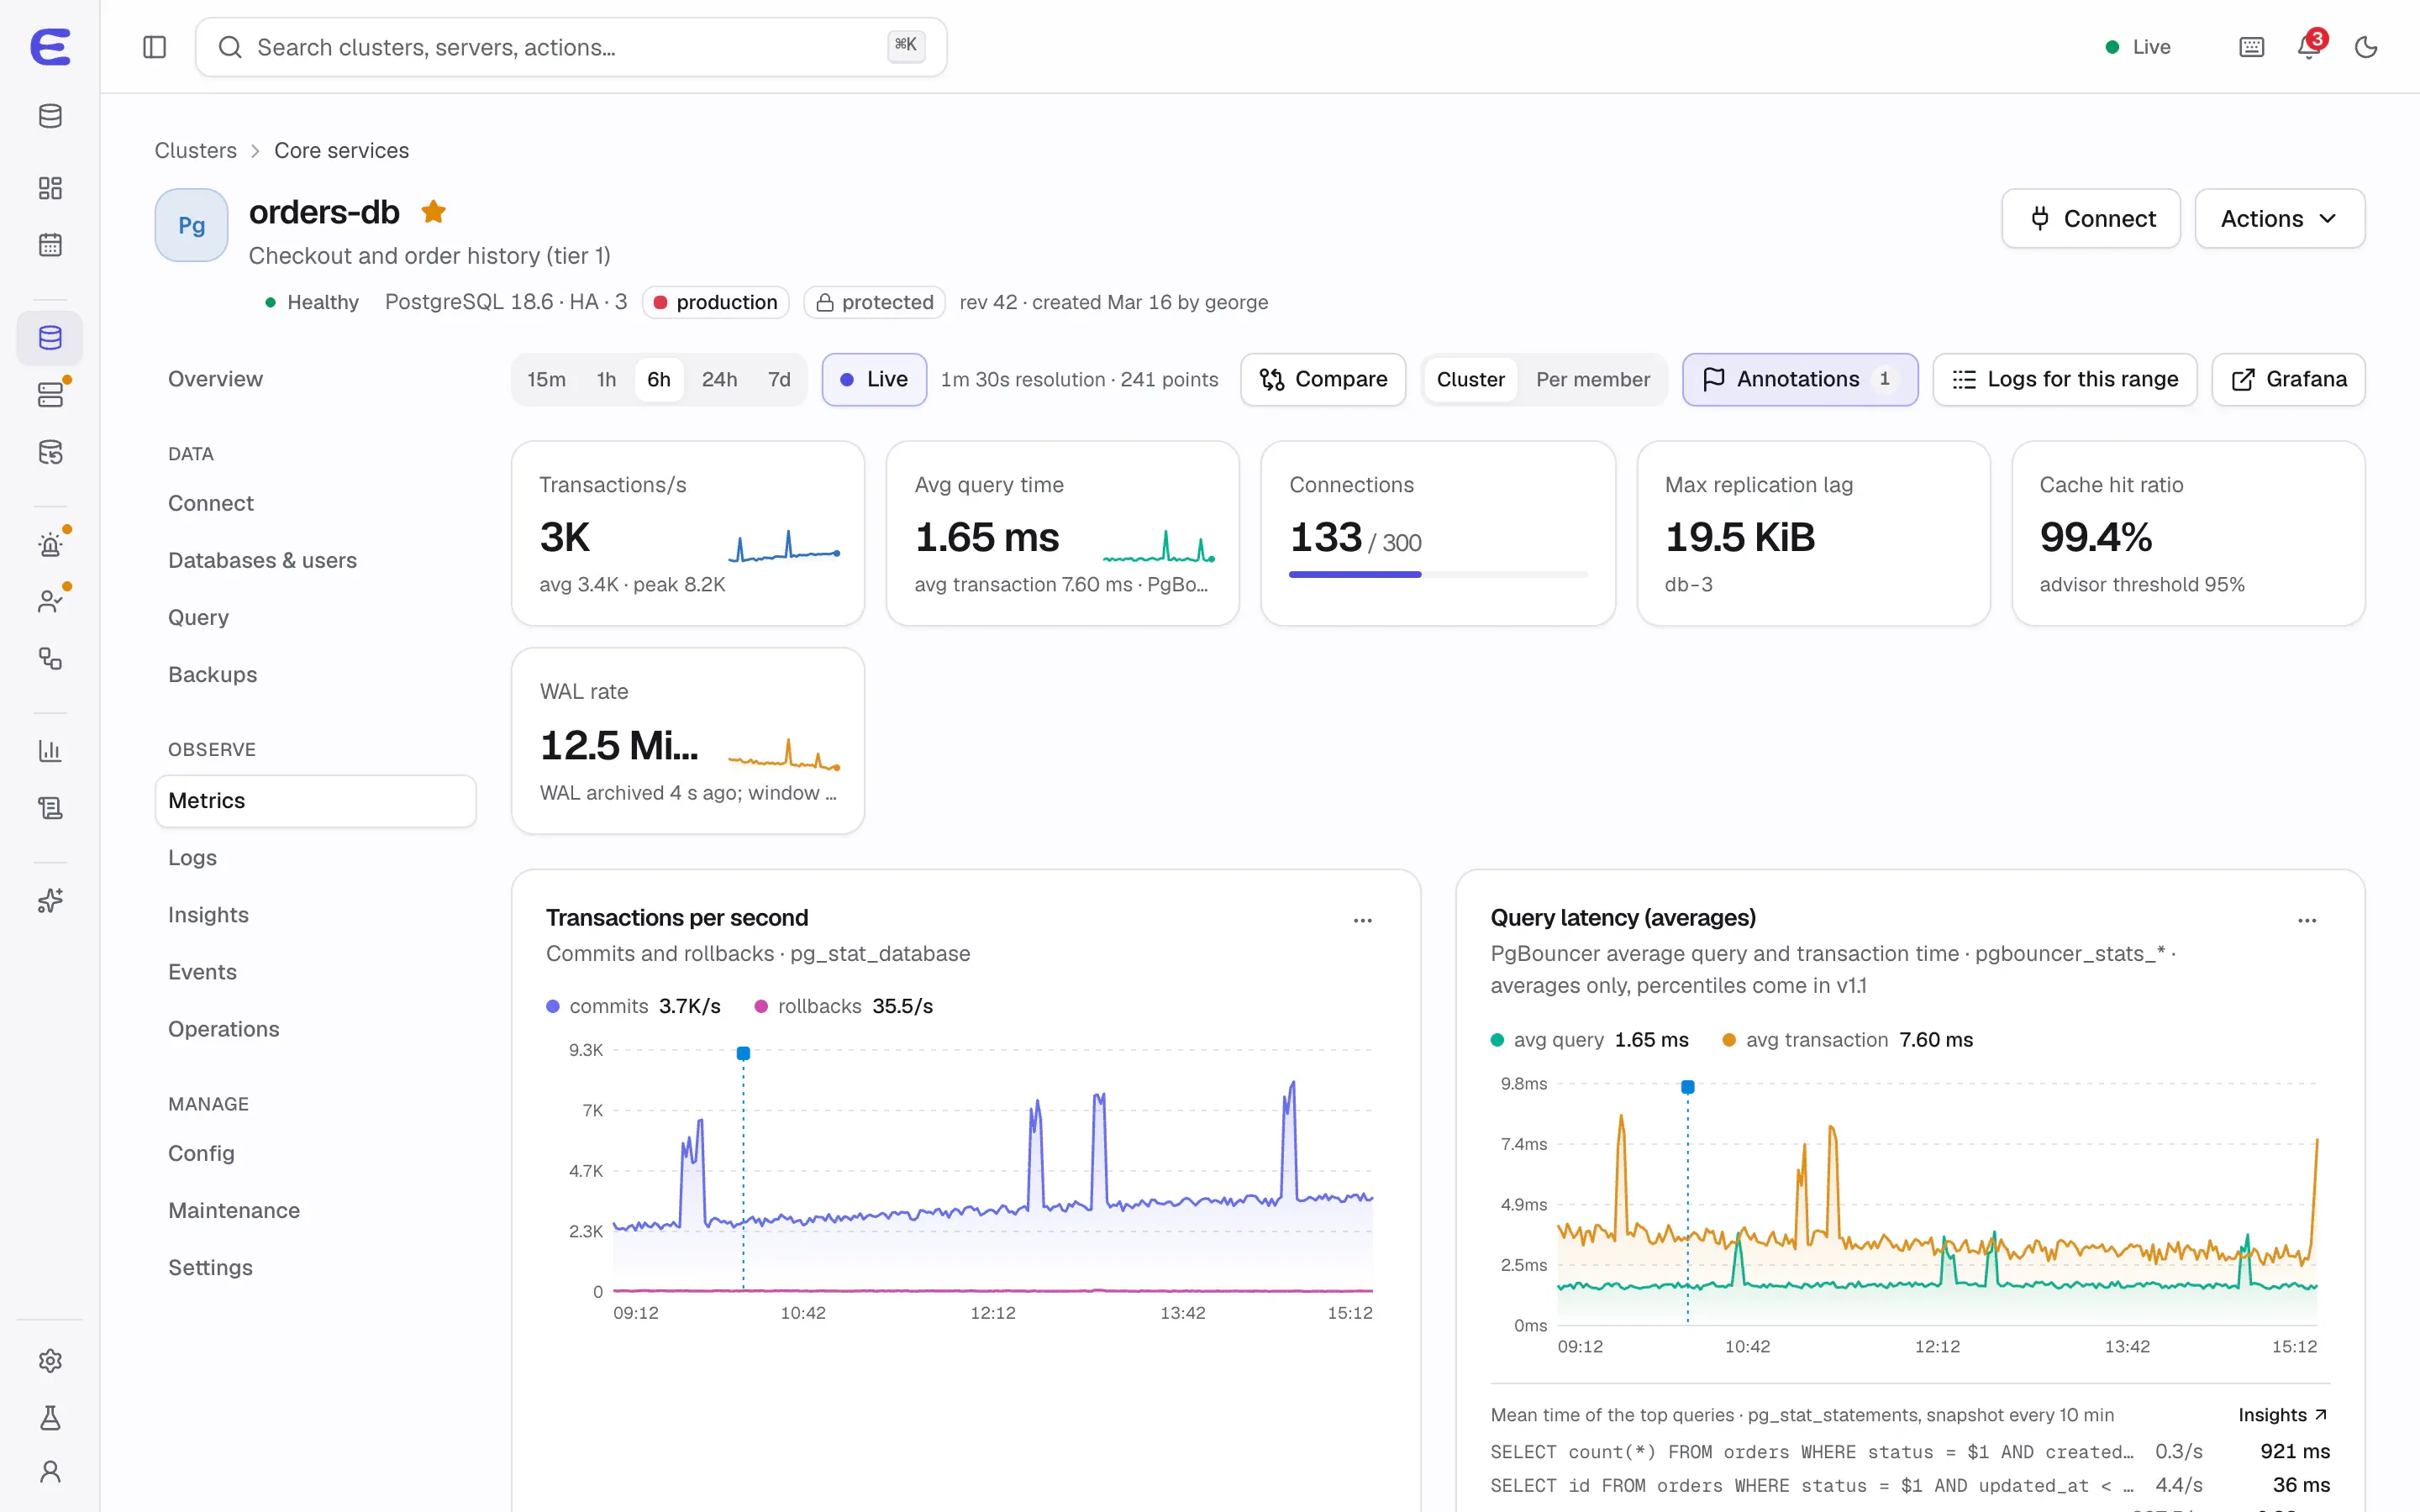
Metrics tab of orders-db: transactions per second, average query time, connections, replication lag, cache hit ratio and WAL rate, with charts for transactions and query latency and annotations.
orders-db’s metrics, with time range, comparison and annotations. Interactive demo, simulated data. Open this screen in the demo

Health you can read at a glance

Agents probe every member and report conditions such as whether the cluster can read, can write and has quorum, each tracked separately. A condition changes only after two consecutive observations, and evidence that is too old turns it to “unknown” instead of pretending everything is fine. The same health report drives the console, the alerts and an AI assistant’s diagnosis.

Metrics

Agents collect engine and host metrics every 15 seconds into a time-series database built into the control plane, which answers PromQL queries. Each engine has a curated set of charts; you can compare with the previous period and see failovers, configuration changes and your own deploy markers as annotations on every chart.

  • Metrics are kept for 15 days or 40 GB, whichever comes first.
  • A Prometheus-compatible endpoint lets Grafana read them directly, and ready-made dashboards ship for every engine.
  • Large fleets can send metrics to Prometheus, VictoriaMetrics or Mimir instead; that becomes necessary beyond about 500 servers or 30 days of history.
  • Heavy queries are limited so they can never delay alert evaluation.

Logs and events

Logs are fetched from the servers when you look at them, with counts per level for the last 24 hours. Multi-line entries are joined, levels are normalised across engines, and secrets and literal values in slow-query lines are masked before they leave the server. A 90-day event timeline per cluster records failovers, configuration changes, operations and alerts in order.

Alert rules with runbooks

About 100 alert rules ship with ElastiCluster, each with a concrete threshold, a duration, a severity and a runbook that says what to do. Examples include a cluster without a primary, replication lag, failing log archiving, a disk filling up, an overdue restore drill and an agent that stopped reporting. A rule without a runbook fails the build.

  • Override thresholds per project, environment or cluster.
  • Acknowledge an alert until it resolves, or silence matching alerts for a while, with undo.
  • When more than one server in ten drops at once, a single alert about the outage replaces dozens of individual ones.
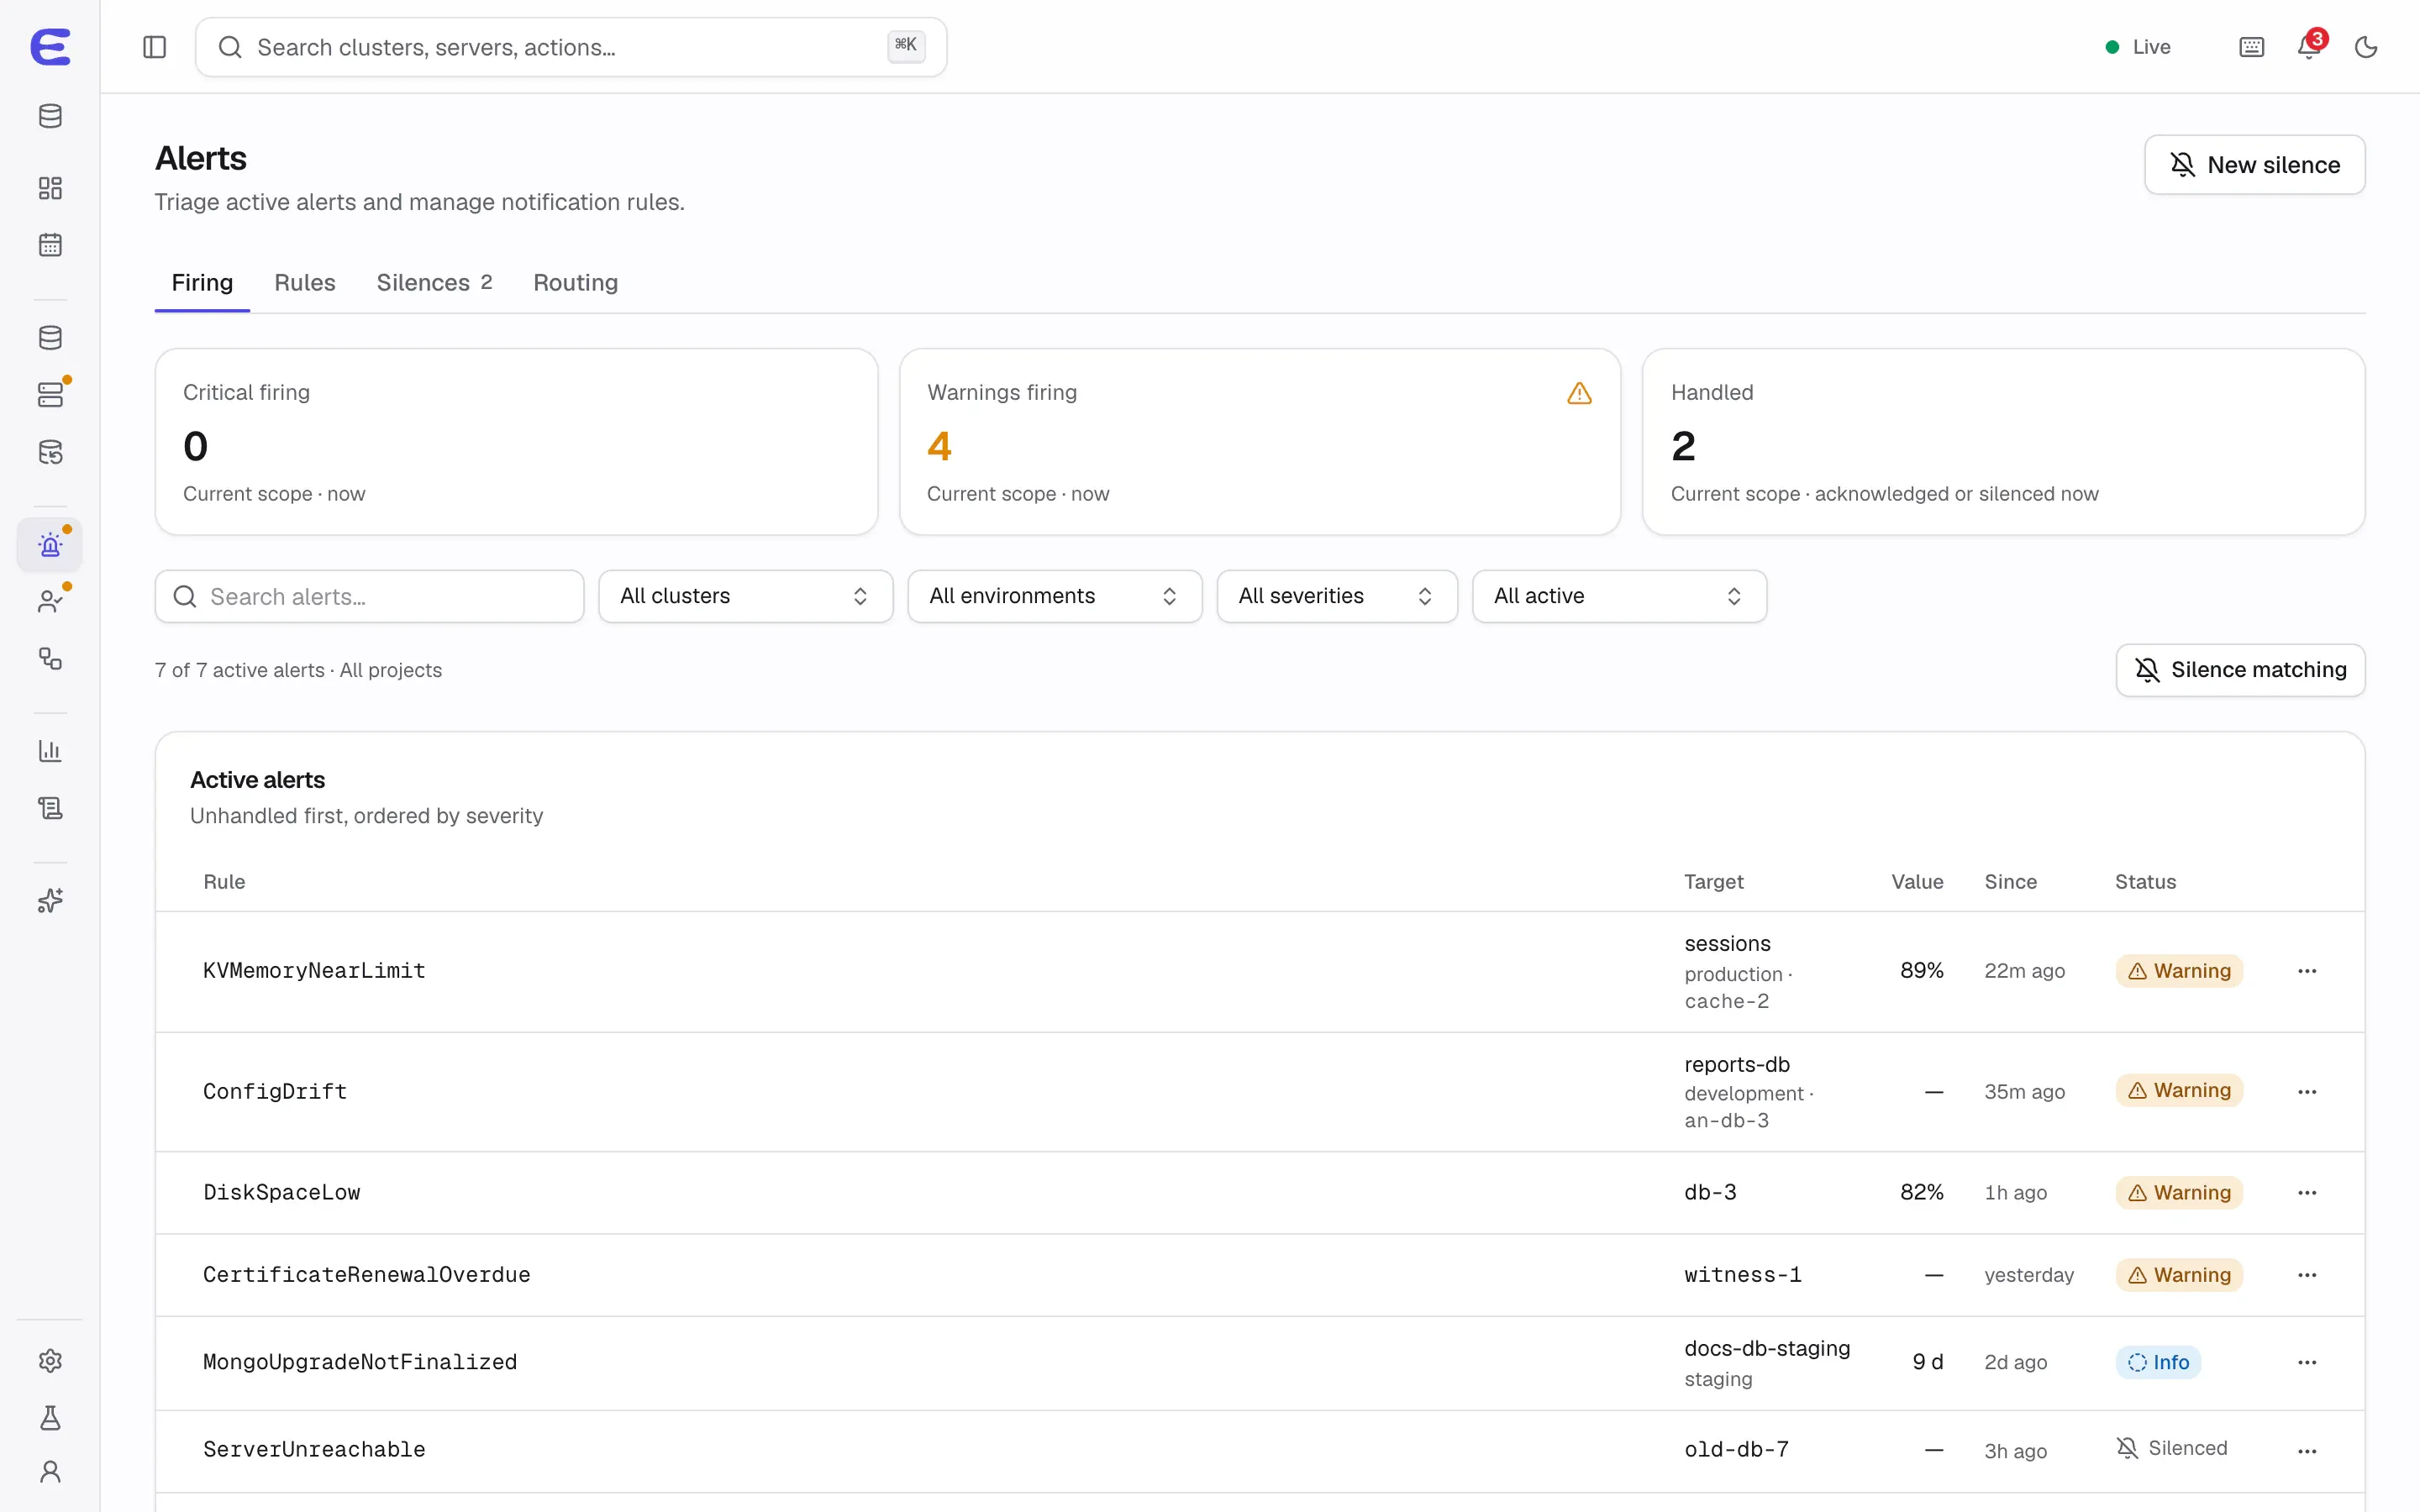
Alerts page: no critical alerts, four warnings and two handled; active alerts include memory near limit on sessions, configuration drift on reports-db, disk space low on db-3 and an overdue certificate renewal.
Firing alerts across clusters, ordered by severity. Interactive demo, simulated data. Open this screen in the demo

Notifications

Alerts go to e-mail, Slack, Discord, Telegram, Microsoft Teams or a signed webhook, routed by severity and labels. Each channel is rate-limited, and a burst becomes a digest such as “27 more alerts” instead of a flood. PagerDuty and Opsgenie are planned for v1.1.

Reports

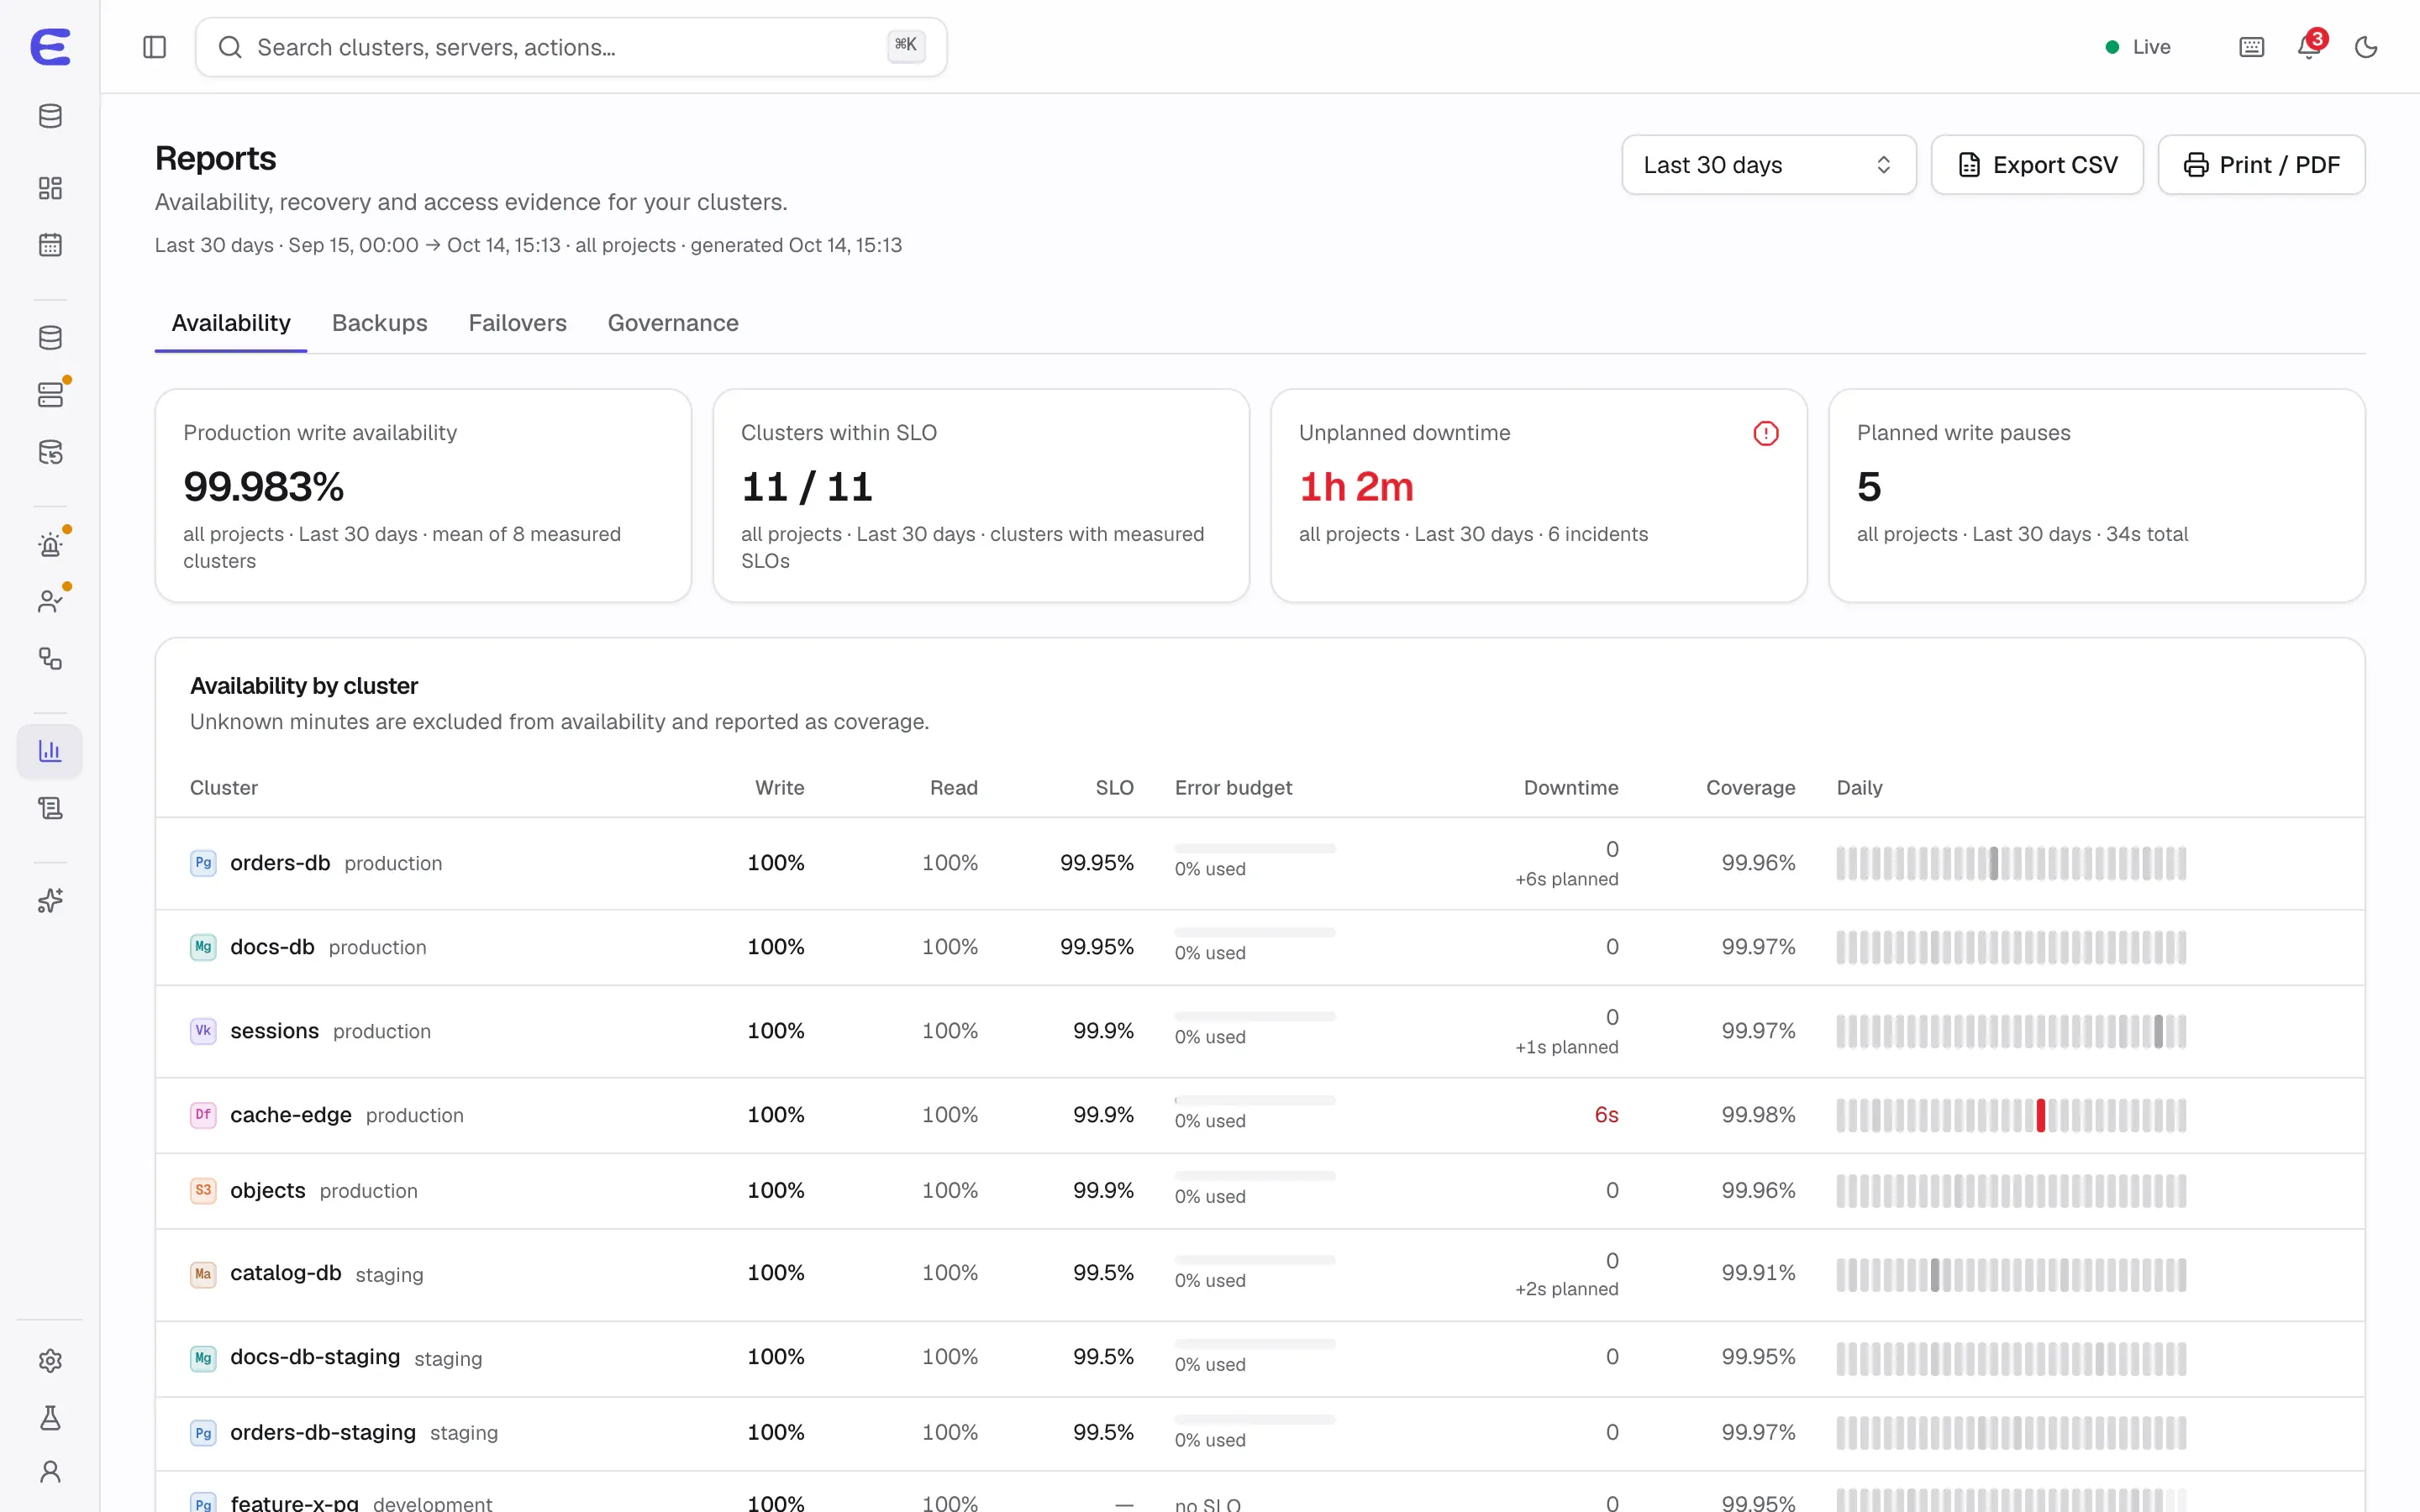
Monthly reports show availability per cluster minute by minute, separately for reads and writes, with minutes where the evidence was missing excluded and the coverage shown. They also cover failovers, backup success, restore drills and their measured restore times, plus governance: who has access, which credentials exist and how policies are set. Reports export to CSV and print-ready PDF.

Watching the watcher

If the control plane itself stops, it cannot send an alert about that. It can send a heartbeat every minute to an external service such as Healthchecks, Uptime Kuma or Better Stack, which alerts you when the heartbeats stop.

Status

Agents already collect host metrics and stream logs in development builds. The time-series database, dashboards, alert engine and notifications are planned for v0.3; reports follow in v0.8. In the demo, the “Disk filling up on db-3” scenario shows an alert from first warning to resolution.

Availability report: production write availability over 30 days, the clusters within their objective, unplanned downtime, planned write pauses, and per-cluster write and read availability with error budgets.
The availability report, with read and write availability per cluster. Interactive demo, simulated data. Open this screen in the demo

Try the console before it ships

The interactive demo runs the whole console on simulated data. Trigger a failover, approve an AI assistant’s plan, restore a backup to a point in time. Nothing to install.